GeoBeer Analytics

A collection of analytics about GeoBeer events, including the tools to produce them. Hopefully useful also to other meetup and event organisers.
Gender balance of our audience
Background and rationale
With GeoBeer, we want that everybody with an interest in «geo» feels welcome at our events. Specifically, our manifesto declares:
- «Networking is inclusive: Everybody adds value.» and
- «We (…) welcome everybody: all genders, creeds and colours, citizen or expat, speaking French, Italian, German, Romansh, English, Python, C# or Javascript.».
We want to make GeoBeer events better events by holding up these principles (and the remaining principles of the manifesto).
Against this background, we sometimes discuss questions of openness, representation, and diversity within our team and with some of our sponsors, organisers, and audience members. Questions of representation pertain to many characteristics of humans, of course. For example, age, nationality, gender, path of education, language, sexual orientation, race, and many more.
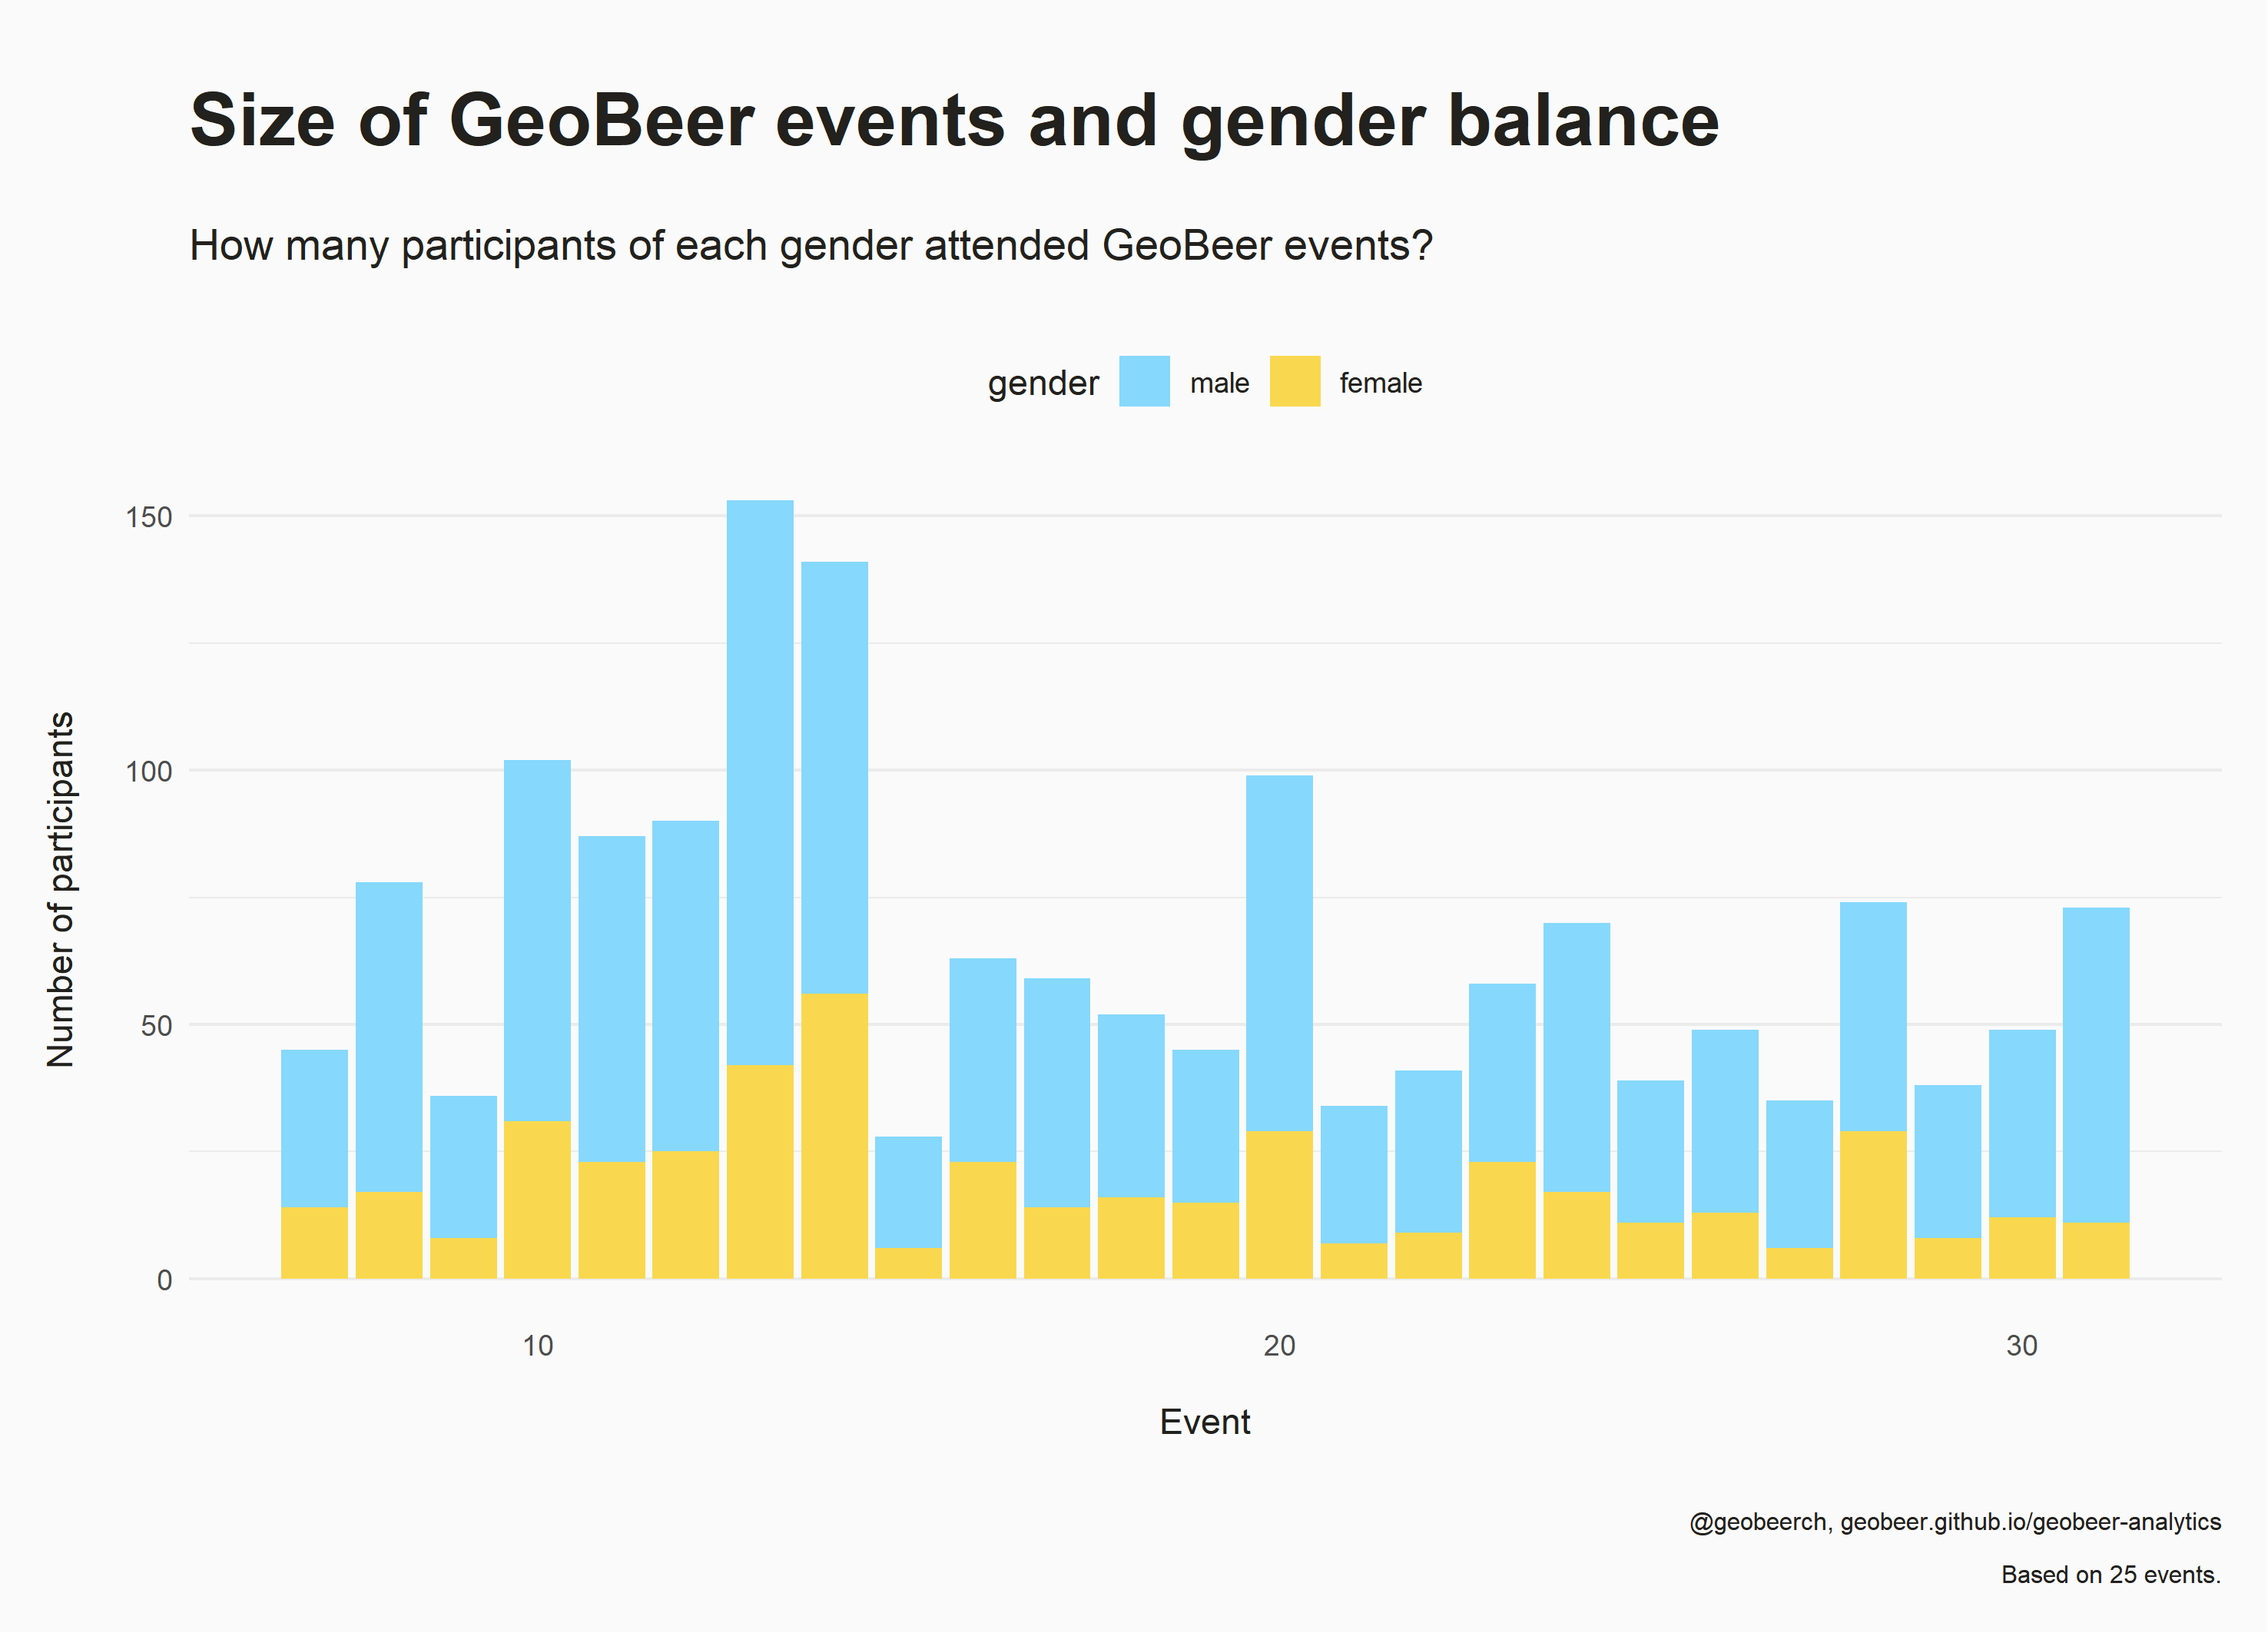
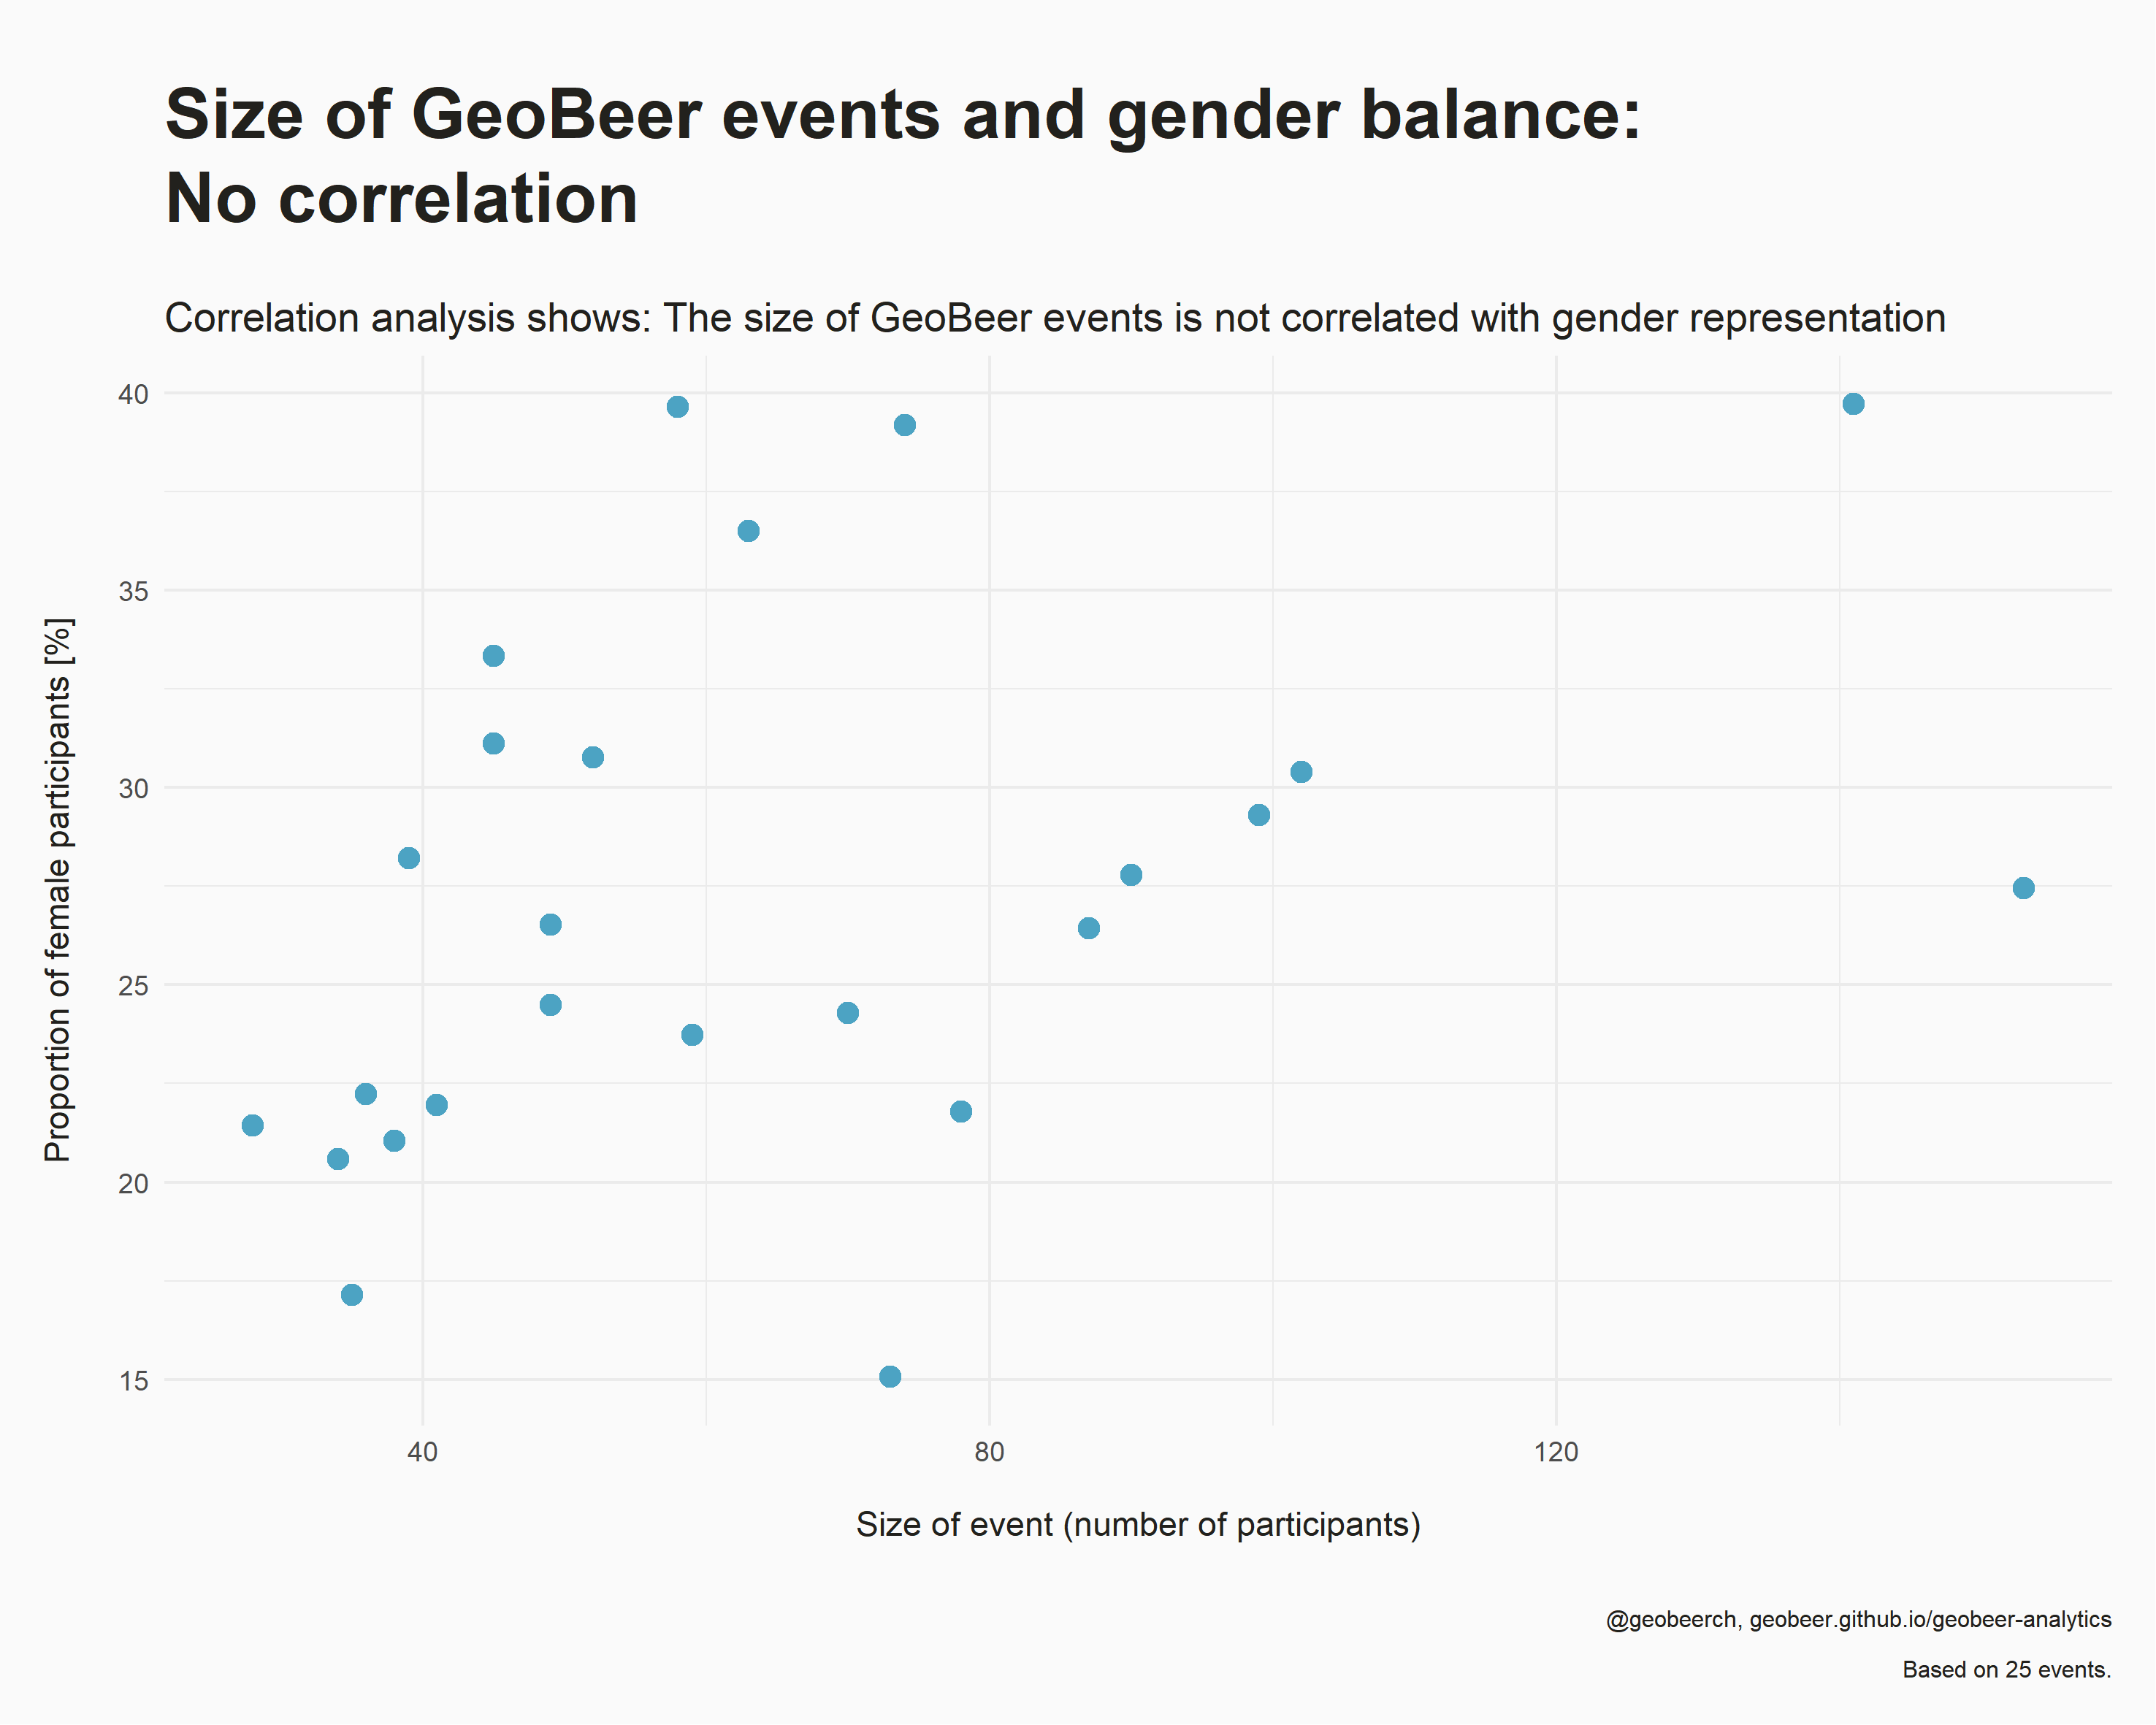
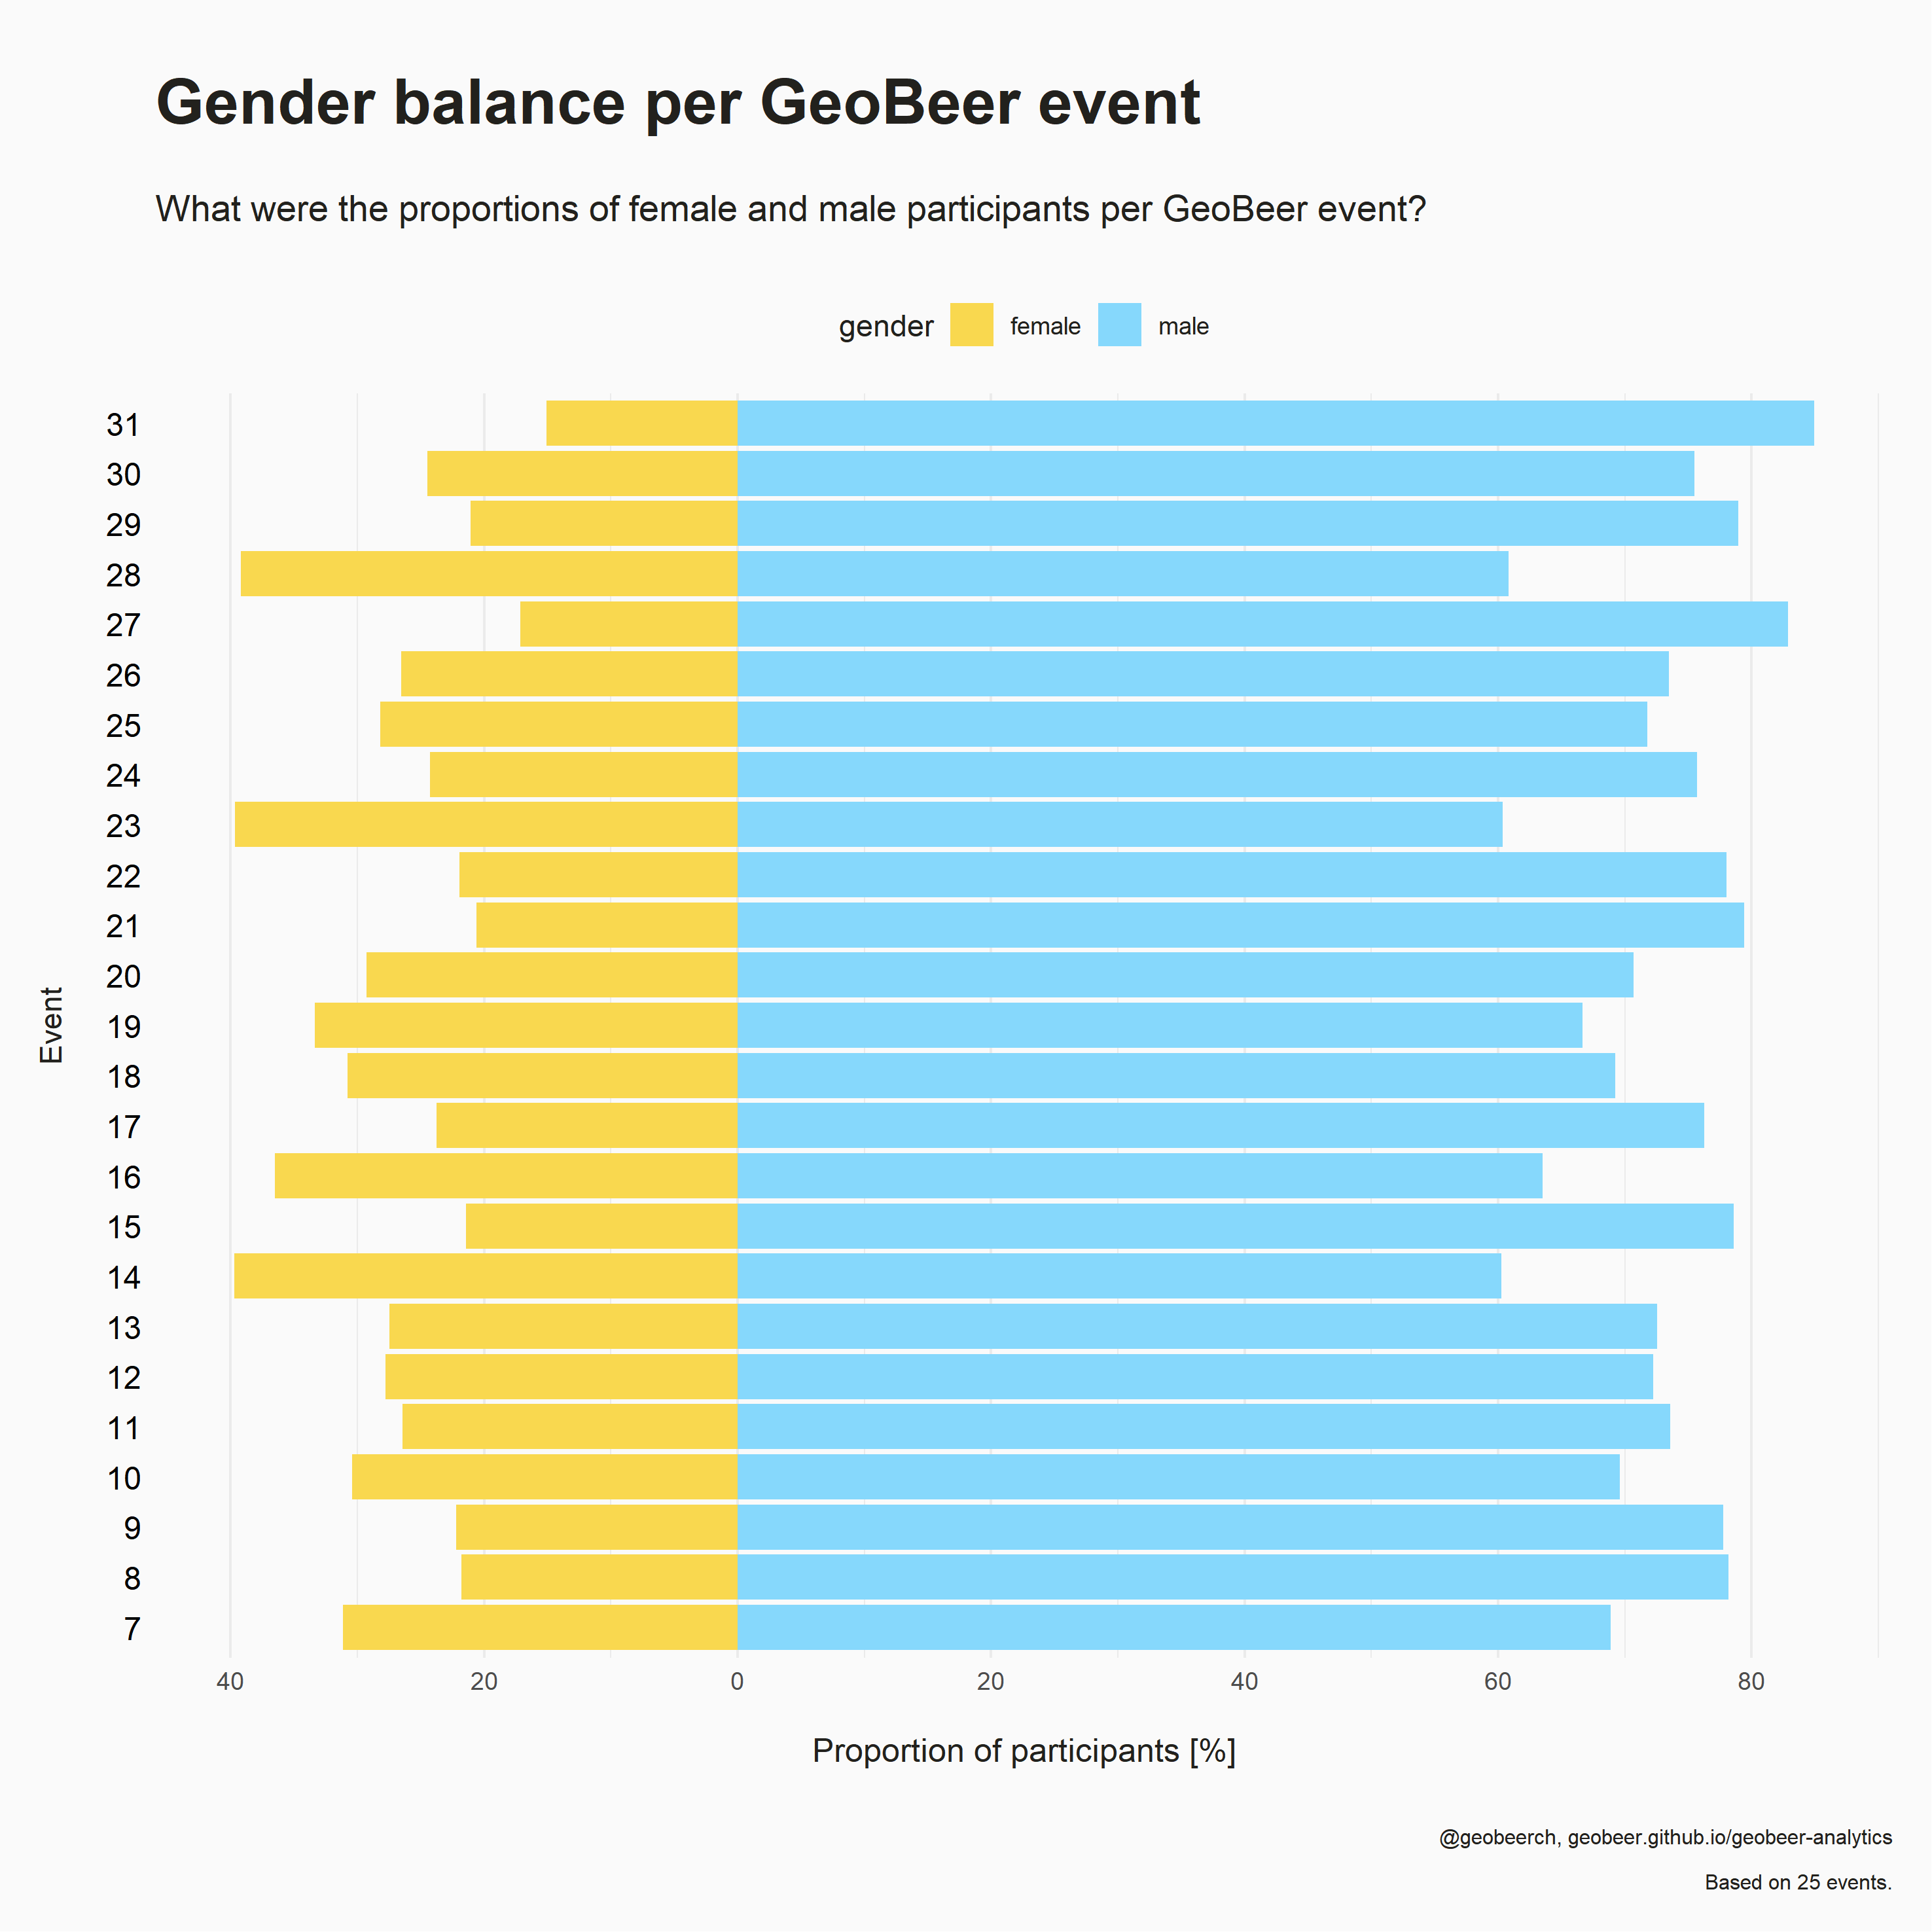
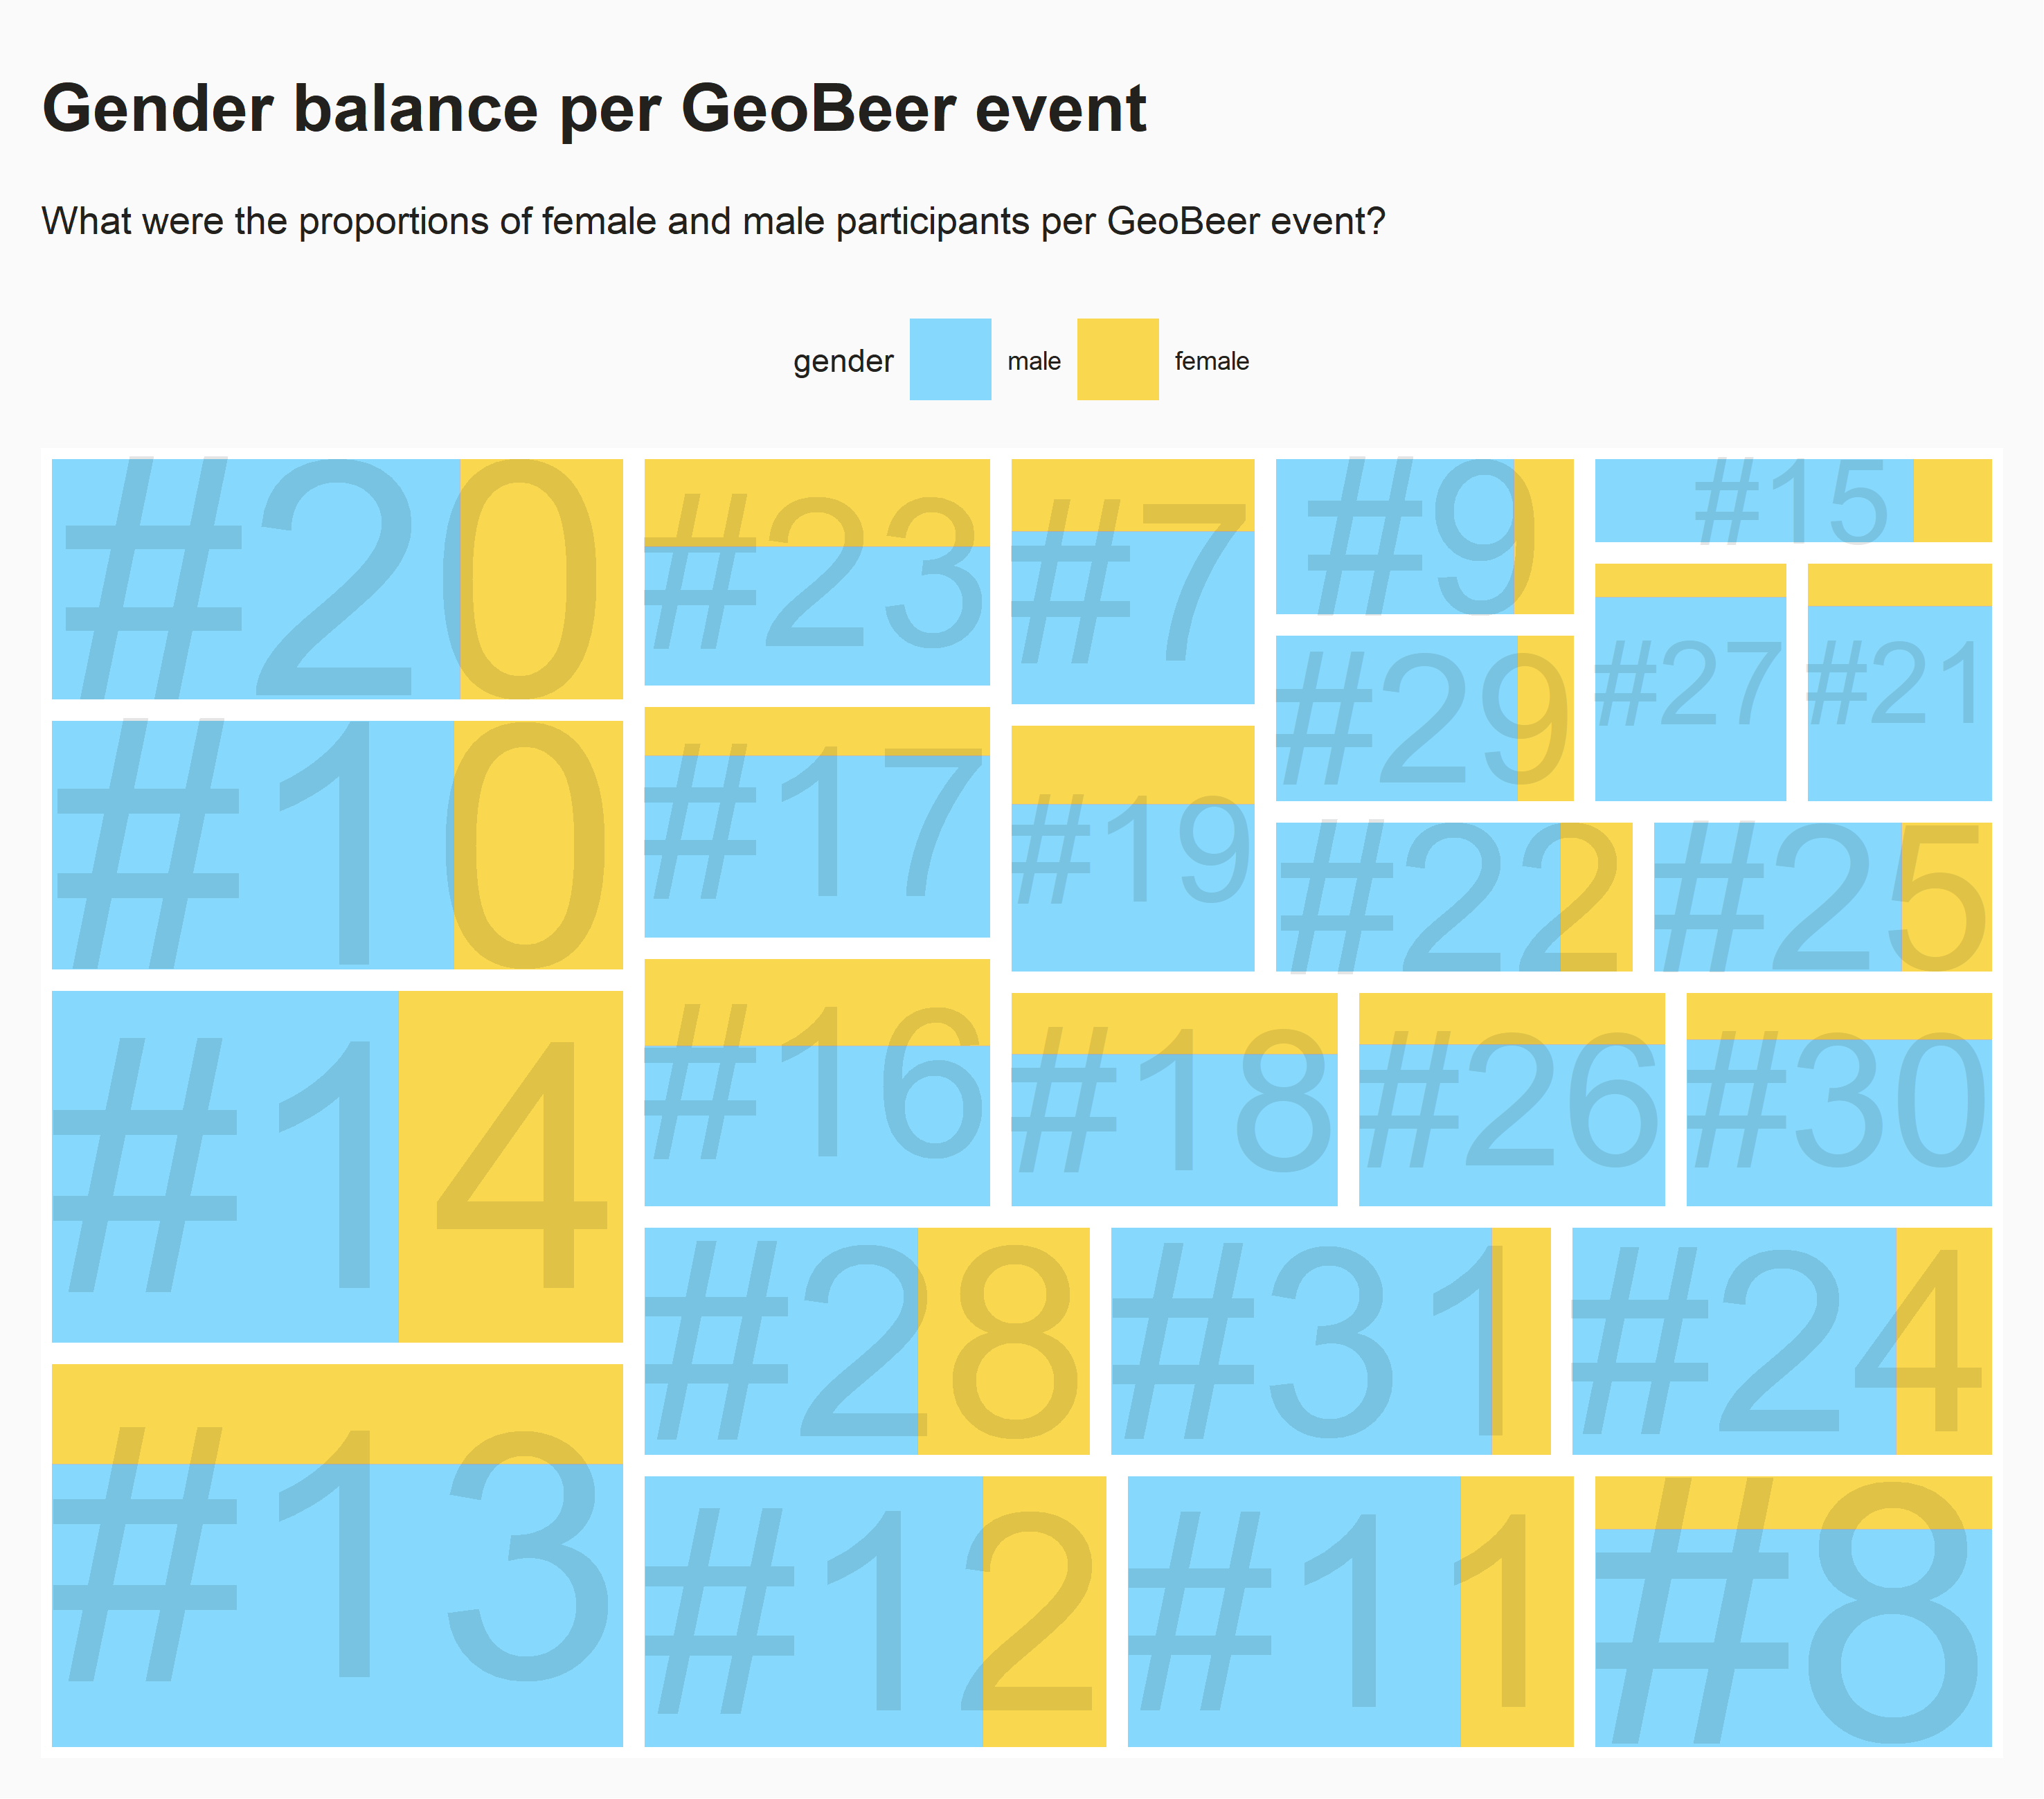
Here, we derive some data on representation by looking at gender balance of the GeoBeer audience. We chose gender balance, as this is one representation metric that we can estimate based on our existing data from the registration process (we do not currently record data on, e.g., language, age, or nationality).
Data and baselines
With this investigation, we obtain first data points about the Swiss GIS industry from a sample of limited size (our registration data starting from GeoBeer #7). In order to make sense of our data, we felt the need to include additional data that could serve as a baseline for our numbers. Thus, we also look at other geo-related organisations and channels in Switzerland. Specifically, we also analyse the geowebforum.ch and at the SwissGIS Twitter list:
- geowebforum.ch is a public message board where – after free registration – users can post messages in order to disseminate news about events, updates regarding geodata, job openings, and similar topics. The news is shared on the site, through an RSS feed, an e-mail newsletter and a Twitter bot.
- The SwissGIS Twitter list is a list of Twitter accounts that is curated and continuously updated by Ralph. It actually also is the nucleus of what became GeoBeer. In this list, Ralph collects accounts of persons or institutions who/which are based in Switzerland and tweet about geo-related topics.
Procedure
We analysed the gender balance of the GeoBeer audience as follows: Based on event registration data from the Eventbrite (old) and the Ti.to (current) platform, we analysed the gender of audience members by looking at the first names they gave for registering to GeoBeer events. Specifically, we analysed (in sequential order, only if the previous approaches haven’t yielded a result):
- first names
- a small fraction of «last names» when people may have flipped their first and last names in the form fields
- a small fraction of parts of e-mail addresses
Lastly, we manually classified a few names that wouldn’t yield results otherwise.
The data of geowebforum.ch was scraped using Ralph’s geowebforum-scraper. The accounts on the SwissGIS Twitter list were downloaded using a Python script. Both the geowebforum.ch data and that SwissGIS data were subjected to analysis workflows very similar to the one described above. Unlike our registration data, these data sets do not contain e-mail addresses, however.
Limitations
Several disclaimers are in order as there are simplifications, inherent shortcomings, and potential pitfalls with this type of analysis:
- The analysis relies on functionality provided by the R package
gender(and its supplementary packagegenderdata) (link to documentation). - Gender classification in
genderis based on historical data from the U.S. Social Security Administration birth record data. As such, the classification will have certain biases, e.g. when classifying first names which may have different typically associated genders in different cultures. - Of course, besides people who identify as gender-binary there are non-binary (or genderqueer) persons. Further, some cultures know more than two genders. Unfortunately, data-driven analyses cannot adequately capture all gender categories.
- For classifying gender based on first name using
gender, a range of birth years has to be supplied. As we do not capture any such information from our audience members, we used the timeframe between 1950 and 2000. This may be representative of our audience, or not.
Results
Analysis
The data processing for these visualisations was done using the following R-scripts:
- 0-process-eventbrite-data.R
- 0-process-tito-data.R
- 0-process-swissgis-data.R
- 0-process-geowebforum-data.R
The data on geowebforum.ch was obtained using the geowebforum-scraper by Ralph.
The visualisations were made using the following R-scripts:
- 1-visualize-geobeer-gender-distribution.R
- 1-visualize-gender-distributions.R
- 1-visualize-swissgis-gender-distribution.R
→ Look at our analysis of the event locations
→ Look at our analysis of the ticketing process


